data tables
An important skill when implementing an algorithm is making sure your data variables hold the correct data. One way to do this, is to do so manually with a pen and paper, a whiteboard or an iPad.
What i'm trying to communicate is: the best way to make sure you understand what your algorithm is doing, is to do the number-crunching by hand, and to do so as neatly as you possibly can, by drawing tables of values.
If you're working with a pen, then create clean tables with rows and columns, and draw arrows and show your thinking and your work clearly.
If you're in an editor, then it takes a bit more skill at drawing ascii art, but it can absolutely be done. You're essentially using your editor as a drawing board.
Let's take a look at the greatest common divisor algorithm, with simple numbers: 20 and 30. Let's begin with the high-school method of listing all their divisors.
120              30
210 x 2          15 x 2
35  x 4          10 x 3
42  x 10         6  x 5
51  x 20         1  x 30
The tables above are typical of what you'd actually write out in your editor as a starting point.
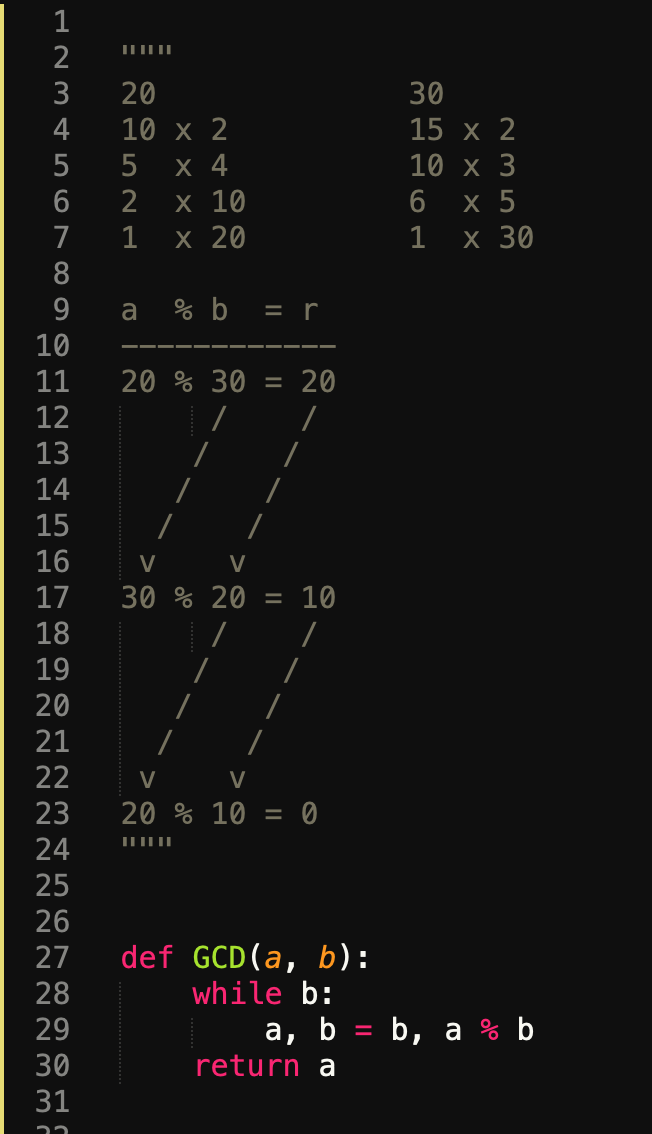
Since we took the time to create this table meticulously, we can clearly see that 10 is the GCD of 20 and 30. Now the algorithm above doesn't seem very efficient; there is a better one.
A better GCD algorithm
Computing remainders is far more efficient. The solution goes like this:
- find the remainder
rofa % b - assign
btoa, andrtob - continue until
b == 0 - the GCD is
a
Now we could jump straight into code, however let's prove to ourselves that it works first:
 1a  % b  = r
 2------------
 320 % 30 = 20
 4     /    /
 5    /    /
 6   /    /
 7  /    /
 8 v    v
 930 % 20 = 10
10     /    /
11    /    /
12   /    /
13  /    /
14 v    v
1520 % 10 = 0
Implementation
We seem to have design an algorithm, so let's attempt to implement it.
1def GCD(a, b):
2  while b:
3      a, b = b, a % b
4  return a